In a competitive market, "gut feeling" isn't enough. The most successful businesses are data-driven. They measure, analyze, and adapt. Your digital pass program is no different. Launching a loyalty card, event ticket, or gift card is just the first step. The real value comes from understanding how your customers are interacting with them.
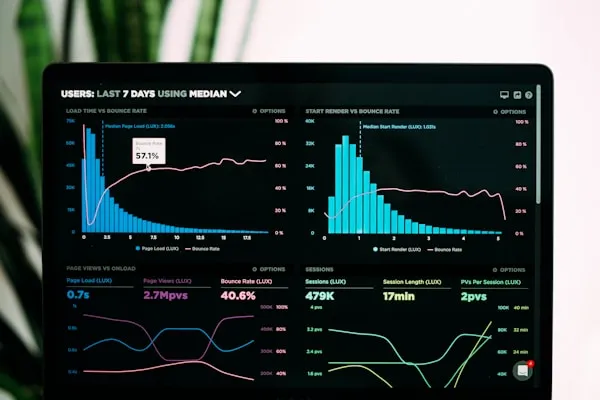
This is where WePass Analytics comes in. Instead of guessing, you get a clear, quantitative view of your program's performance. Our built-in analytics dashboard transforms raw numbers into actionable insights, helping you optimize your campaigns, improve customer engagement, and maximize your return on investment (ROI).
What You'll Learn
Discover the key metrics in your WePass dashboard and how to use them to make smarter, data-driven decisions for your business.
Key Metrics That Matter: What to Track and Why
Your WePass dashboard is packed with valuable data. Let's break down the most important metrics and what they tell you about your business.
1. Pass Performance & Distribution
- Total Passes Issued: The top-line number showing your program's overall reach.
- Passes Installed: This is crucial. It's not just how many passes you sent, but how many were actually added to a mobile wallet. A low install rate might signal issues with your distribution email or landing page.
- Installs by Channel: Are customers downloading your pass from an email link, a QR code in-store, or an SMS campaign? This tells you which channels are most effective.
Actionable Insight: If you see a high number of "Issued" passes but a low number of "Installed" passes from your email campaign, try A/B testing your email's subject line or call-to-action (CTA) to improve conversion.
2. Customer Engagement & Behavior
- Pass Updates: How many passes have been updated (e.g., new point balance, new offer)? This shows that your program is active and providing real-time value.
- Pass Views: How often are customers looking at your pass? High view counts, especially around the time you send a push notification, mean your messages are being seen.
- Location-Based Engagement: If you use location-based notifications, this metric shows how many customers are getting a lock-screen alert when they're near your store.
Actionable Insight: Low engagement? Try sending a targeted push notification with a limited-time offer to draw customers back in. The analytics will show you the direct impact on pass views and redemptions.
3. Redemption & ROI
- Redemption Rate: The ultimate success metric. What percentage of your issued passes (or specific offers) are being redeemed?
- Redemptions Over Time: Do you see a spike in redemptions after sending a marketing email? This helps you attribute sales directly to your efforts.
- Average Transaction Value (ATV): By integrating with your POS, you can track if customers with a loyalty pass spend more per transaction than non-members.
Actionable Insight: If a specific "20% Off" offer has a much higher redemption rate than a "Buy One, Get One" offer, you've learned what truly motivates your customers. You can then adjust future campaigns accordingly.
Pro Tip: Segment Your Data
Don't just look at overall numbers. Use pass data to segment your audience. Compare the behavior of new loyalty members vs. long-time VIPs. How do redemption rates differ between customers acquired via email vs. in-store? This segmentation unlocks deeper, more powerful insights.
Conclusion: From Data to Decisions
WePass Analytics does more than just show you charts; it gives you the power to make smarter business decisions. By understanding exactly how your customers engage with your digital passes, you can stop guessing and start optimizing.
Use these insights to refine your offers, improve your distribution strategy, and prove the ROI of your marketing efforts. The data is at your fingertips—it's time to use it.
Ready to see your own data in action? Log in to your WePass Dashboard and explore the "Analytics" tab today.